

Reading your analytics
What each section on the Analytics page is counting, and the ones worth acting on.
Analytics answers questions about your business that are hard to hold in your head. Every number comes from bookings you already have, so there is nothing to set up and nothing to keep up to date.

The five totals across the top are the quick read: total events, active artists, new events and assignments in the last 30 days, and the average number of artists per event. Everything below opens and closes, so you can leave the page showing only the sections you care about.
⚠️ Some sections say imports excluded. Bookings you imported from a spreadsheet have no real inquiry date and no real booking history, so counting them would invent a pattern that never happened. A brand new account with imported history will show those sections empty until real bookings arrive.
Booking patterns
When bookings come in, by day of the week and by time of day.
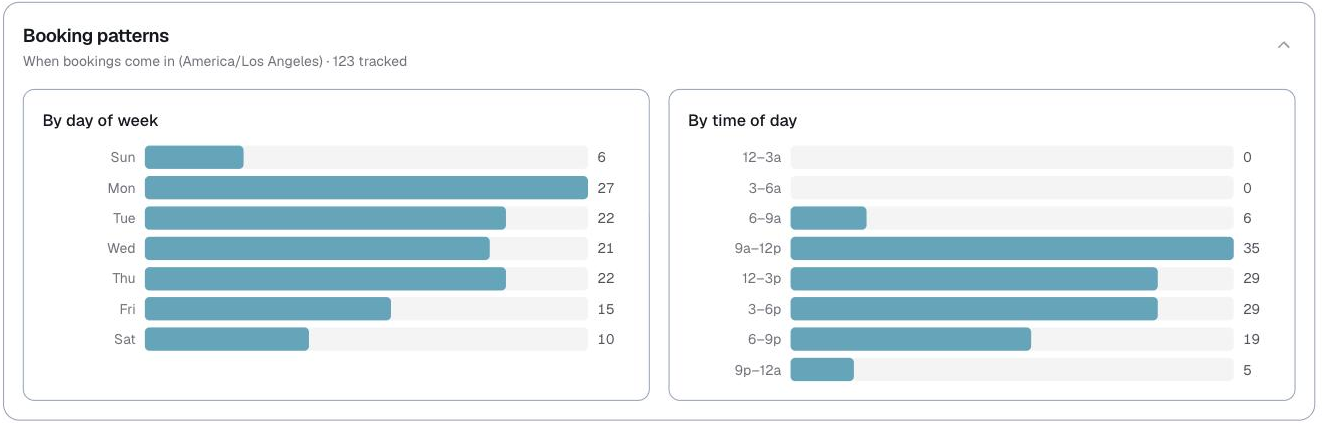
This is the one that changes staffing decisions. If most of your work lands on two days, that tells you what your roster needs to look like, and it is usually more lopsided than people expect.
It also tells you what to ask your team for. There is little point chasing weekday availability if you almost never book a weekday.
Bookings by month
Two charts: one by the month the event takes place, one by the month the booking came in.
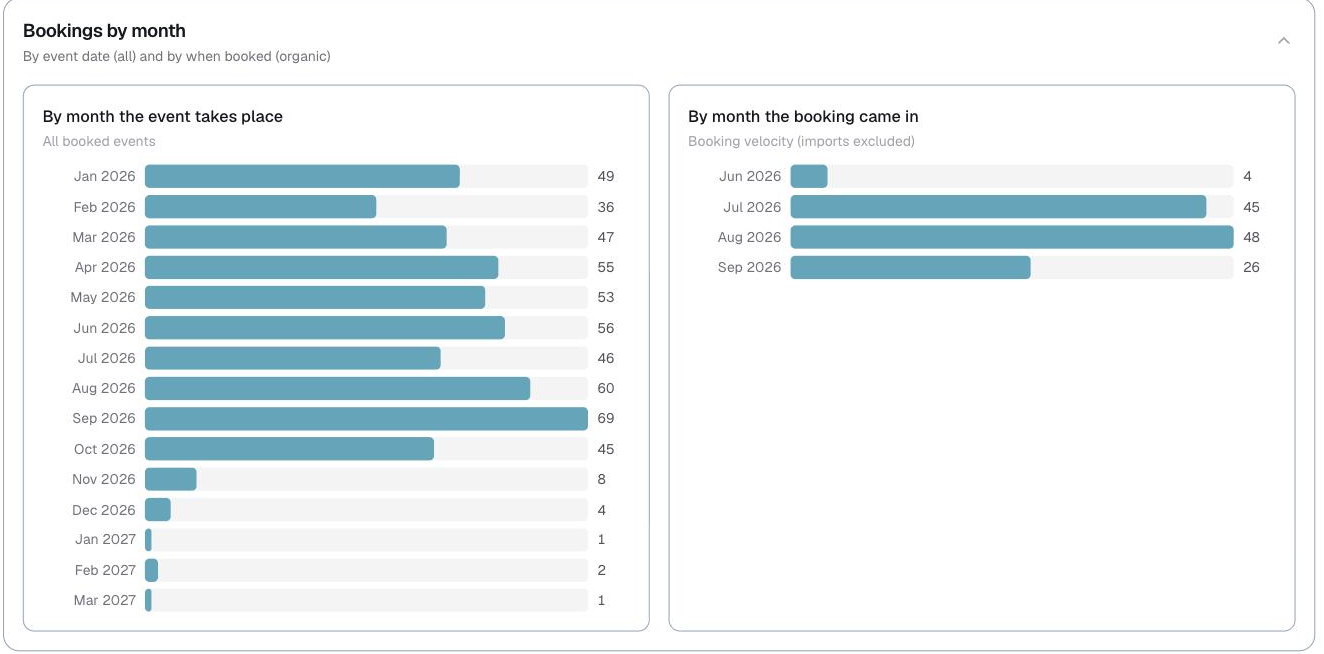
They are not the same thing, and the gap between them is your lead time. A quiet booking month is not a quiet working month if that work was booked earlier in the year.
Conversion
How many inquiries turned into bookings.

Worth watching over time rather than in any one month. A drop usually means something changed in how fast you are replying or what you are quoting, and both of those are fixable.
Outreach
How often you are asking people to take shifts, and how often they answer.
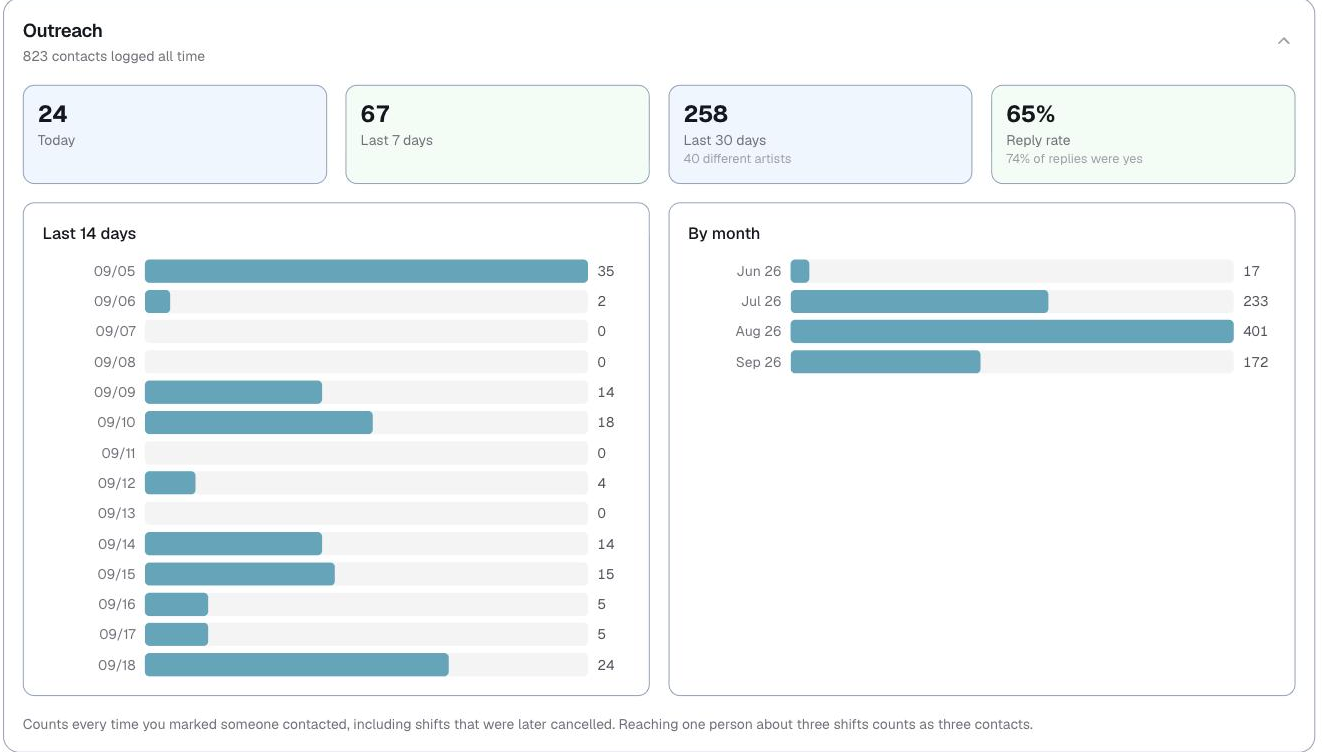
You get contacts today, in the last 7 days and in the last 30 days, how many different artists that reached, your reply rate, and how many of those replies were yes. Underneath, the last 14 days day by day, and a total per month.
A low reply rate is not always about the people. It can mean you are asking too far ahead, or asking the wrong list, or asking for work in an area nobody has said they will travel to.
⚠️ It counts every time you marked someone contacted, including for shifts that were later canceled. Reaching one person about three shifts counts as three.
Repeat clients
What share of your clients come back.
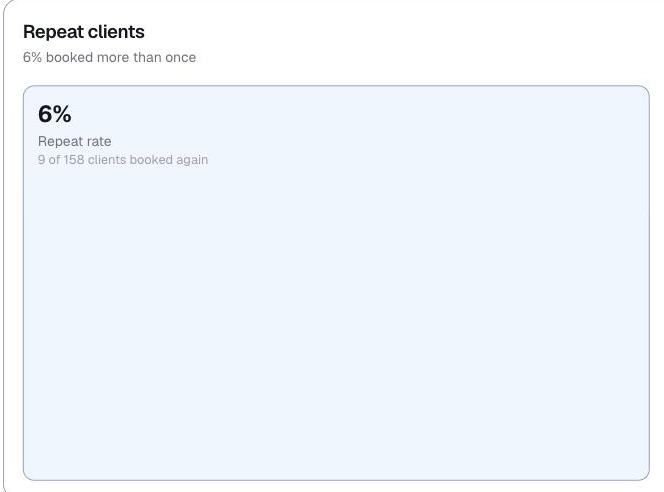
Beside the rate is your top repeat clients by number of bookings. Repeat work is the cheapest work you will ever get, so if this number is low it is usually worth more than chasing new inquiries.
Services and artists
Two lists side by side: your most booked services, and your artists ranked by hours worked.
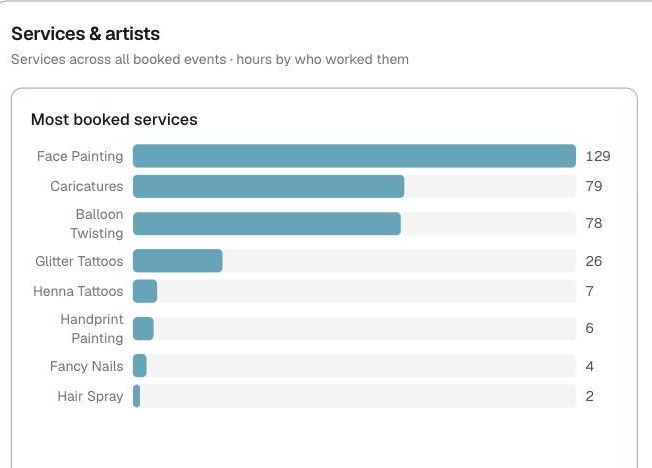
The services list tells you what to hire for and what to train for. If one service is half your calendar, your roster needs depth in it.
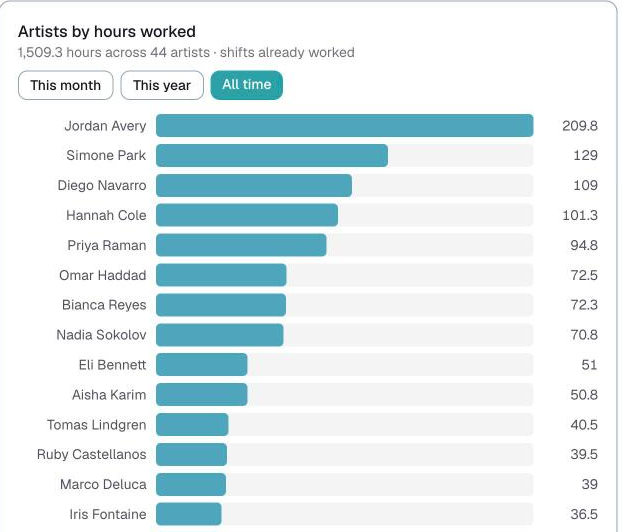
The artists list has This month, This year and All time. It is useful for two things: seeing who is carrying your calendar, and noticing the person who used to work every weekend and has quietly dropped off.
If you run without pay, this still works. It counts hours instead of money, and the pay report becomes an hours report to match.
Lead time to booking
How long it takes an inquiry to turn into a booking, from same day to a month or more, with your average.
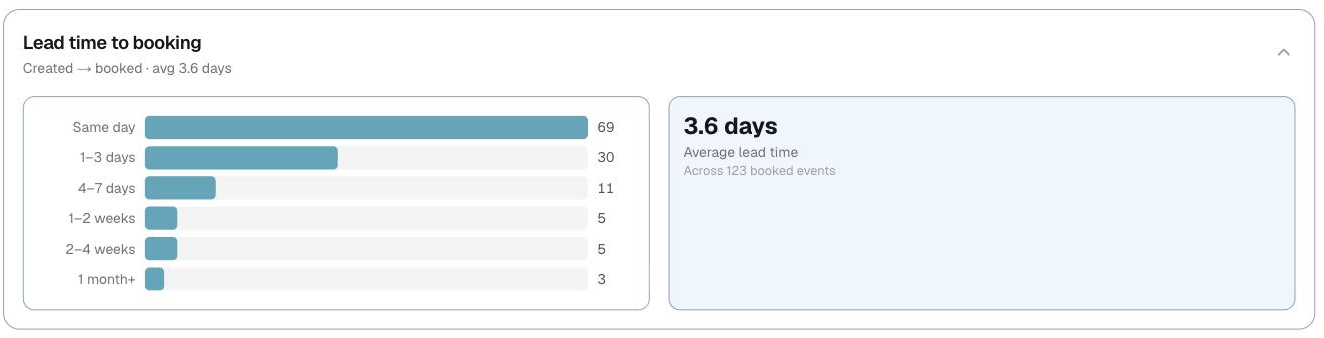
This is the number to hold onto when you plan how far ahead to ask your team. If most of your work books inside a few days, asking people to fill in three months of calendar is asking for something nobody can answer.
Last updated